
All five DORA metrics
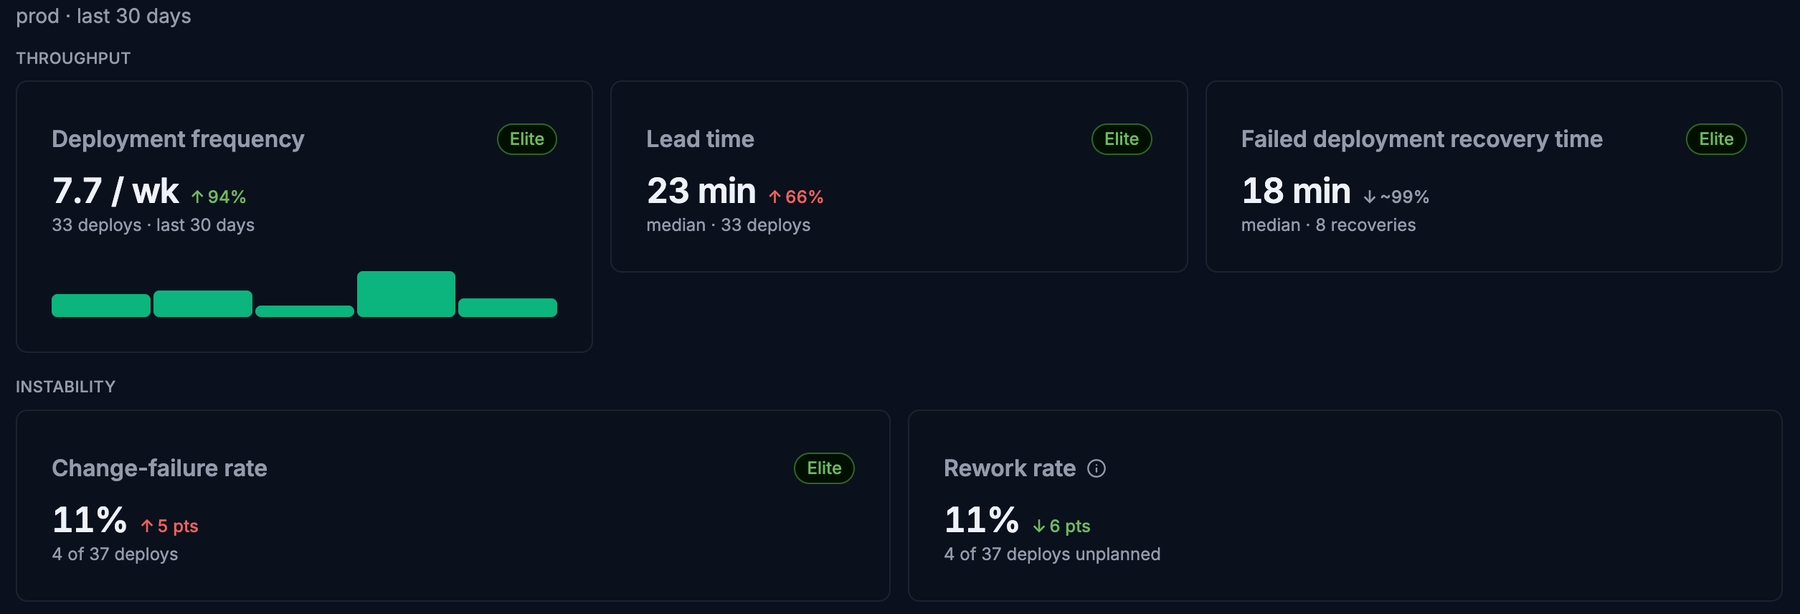
Deployments reports all five of DORA's software delivery metrics for production, computed from your deployment history, so nobody keeps a spreadsheet to know how delivery is going.
Teams that report delivery performance usually assemble it by hand from deployment logs and incident tickets, once a quarter. The numbers arrive late, and stop being kept the day the person who built the sheet moves on.
The Insights tab on Deployments now shows all five of DORA's software delivery metrics, grouped the way DORA groups them. Throughput is deployment frequency, lead time and recovery time after a failed deployment. Instability is change failure rate and rework rate, the share of deployments that were unplanned repairs. Every number is computed from the production deployment history Taiga already reads, never entered. Each shows its trend against the previous 30, 60 or 90 days and, where DORA publishes one, a performance band. A metric with too little data says so instead of showing a number.
A hotfix that needs a fix of its own counts as rework twice, which is how a team stuck firefighting shows up.
Delivery performance becomes something you can check on any day, by the definitions the industry already benchmarks against.
Every change, dated the day it shipped.
Dated the day they shipped, newest first.